


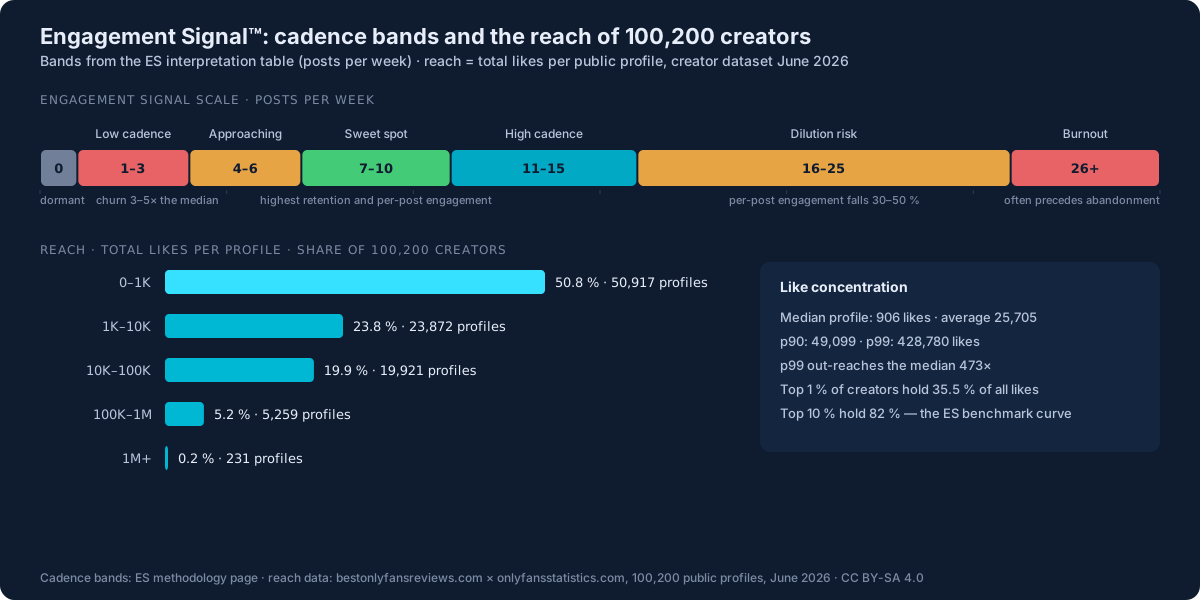
أطروحة "النقطة المثلى"
ثلاث لوحات بيانات مستقلة — استطلاعات وكالات المنشئين، وبيانات مُبلَّغ عنها من أدوات المنشئين، وتقارير علنية من وكالات مثل Hoopr وBunny Agency وGoon — تتفق على النتيجة نفسها: منشئو محتوى OnlyFans الذين ينشرون 7 ± 2 مرات أسبوعيًا يتمتعون بـ:
- أعلى معدلات احتفاظ بالمشتركين (أدنى تراجع شهري للمشتركين)
- أفضل تفاعل لكل منشور (الإعجابات، الإكراميات، مشتريات الرسائل المباشرة لكل منشور)
- أقوى مسار نمو في أول 6–9 أشهر من عمر الحساب
خارج هذا النطاق، تنهار الحسابات في اتجاهين متعاكسين.
دون 3 منشورات أسبوعيًا: يهيمن التراجع (churn)
يتراجع المشتركون بمعدل 3–5× وسيط المنصة عندما تنخفض وتيرة النشر دون 3 منشورات أسبوعيًا. والآلية: يشترك المتابعون متوقّعين تدفّقًا منتظمًا للقيمة، ويعزّز نظام الإشعارات في المنصة ذلك بإبراز منشئي المحتوى النشطين مؤخرًا. ويتراجع منشئو المحتوى ذوو الوتيرة المنخفضة على كلتا الجبهتين.
فوق 15 منشورًا أسبوعيًا: يتلاشى التفاعل لكل منشور
تنخفض معدلات الإكراميات لكل منشور بنحو 40% مقارنةً بالنطاق 7–9 أسبوعيًا، مع نفاد رغبة المتابعين في التفاعل مع كل محتوى جديد. وتُظهر معدلات فتح PPV لكل منشور تلاشيًا مشابهًا. وغالبًا ما يستقر إجمالي دخل PPV والإكراميات أو حتى ينخفض بعد تجاوز 15 منشورًا أسبوعيًا، رغم استمرار ارتفاع حجم المحتوى الإجمالي.
لماذا يعمل هذا
الحسابات الكامنة وراء ذلك تتعلّق بـانتباه المتابعين المحدود:
- لدى كل متابع ميزانية انتباه شبه ثابتة لكل منشئ محتوى أسبوعيًا — ربما 10-15 دقيقة للتفاعل النشط، و30-60 دقيقة للتصفّح العابر.
- دون 3 منشورات أسبوعيًا، تخرج من عادة المتابع اليومية أو الأسبوعية. فينساك ويتراجع عند التجديد التالي.
- بعد تجاوز 10 منشورات أسبوعيًا، تتنافس منشوراتك الفردية فيما بينها على ميزانية الانتباه ذاتها. فكل منشور جديد يسحب جزءًا من الميزانية من منشوراتك الحالية. وينخفض إجمالي التفاعل لكل منشور.
- نطاق 7±2 هو حيث تبقى حاضرًا باستمرار في ذهن المتابع دون أن تلتهم تفاعلك الخاص.
تفسير وتيرة النشر
| النتيجة | التفسير |
|---|---|
| 0 | راكد. لا يوجد نشاط حديث للحساب. يتراجع المشتركون بنسبة تقارب 100% خلال 60 يومًا. |
| 1 – 3 | وتيرة منخفضة. ترتفع مخاطر التراجع 3–5× مقارنةً بوسيط المنصة. إمّا تسريع الوتيرة أو تقبّل التراجع. |
| 4 – 6 | يقترب من النقطة المثلى. مستدام لمنشئي المحتوى الراسخين ذوي التفاعل الأساسي القوي؛ لكنه محفوف بالمخاطر للحسابات الجديدة. |
| 7 – 10 | النقطة المثلى. أعلى معدل احتفاظ وأفضل تفاعل لكل منشور. المعيار المرجعي للقطاع. |
| 11 – 15 | وتيرة مرتفعة. لا تزال فعّالة لكن انتبه لتلاشي التفاعل لكل منشور؛ وقد يستقر الدخل. |
| 16 – 25 | خطر التلاشي. ينخفض التفاعل لكل منشور بنسبة 30–50%. وغالبًا ما يستقر إجمالي الإيرادات أو ينخفض رغم زيادة المحتوى. |
| 26+ | وتيرة إرهاق. غالبًا ما تسبق التخلي عن الحساب خلال 60 يومًا. خفّض الوتيرة فورًا. |
حالات الاستخدام
- توجيه منشئي المحتوى: قبل اقتراح تغييرات في الأسعار أو إضافة مصادر إيراد، تحقّق من ES أولًا. منشئ محتوى بمؤشر ES يساوي 2 لديه مشكلة في وتيرة النشر تتنكّر في صورة مشكلة تسعير.
- تحديد مخاطر الإرهاق: يرتبط بقاء ES فوق 20 لمدة 3 أشهر فأكثر ارتباطًا قويًا بمنشئي محتوى من الفئة المتوسطة على وشك مغادرة المنصة. وهو مؤشر استباقي يمكن للوكالات استخدامه للتدخّل.
- القياس المرجعي لمحفظة الوكالة: "هل متوسط ES لدى وكالتي أعلى من متوسط القطاع؟" إذا كان الجواب نعم، فقد تكون تدفع عملاءك نحو الإرهاق. وإذا كان أدنى، فقد تكون تفرّط في فرص الاحتفاظ بالمشتركين.
- استراتيجية المنتج: منتجات أدوات المنشئين التي تعرض توصيات "الوتيرة المثالية" للمنشئين لها أثر ملموس وقابل للقياس في الاحتفاظ بالمشتركين عندما يكون ES هو المقياس الأساسي.
القيود
- ES هو الأبسط بين مؤشراتنا الأربعة. إنه ببساطة عدد المنشورات في الأسبوع. نعرضه كـ"مؤشر" لأن عتبات التفسير تحمل معلومات حقيقية — لكن الإشارة الخام ليست رياضيات معقّدة.
- لا يقيس جودة المنشور. 7 منشورات عالية الجهد أسبوعيًا ≠ 7 لقطات شاشة منخفضة الجهد. استخدم Creator Velocity Index إلى جانب ES لالتقاط الجودة عبر أثرها على الإيراد.
- لا يلتقط نوع الوسائط. قد يكون لمنشئ محتوى ينشر 3 فيديوهات طويلة أسبوعيًا أثر تفاعل مشابه لمن ينشر 10 صور. ويعامل ES الحالتين على قدم المساواة.
- المعيار المرجعي 7±2 مستمَد من المتوسط. تتفاوت النقاط المثلى الفردية؛ فبعض التخصصات (القريبة من البث المباشر) تكافئ وتيرة أعلى، وبعضها الآخر (المحتوى المميّز) يكافئ وتيرة أدنى.
كيفية الاستشهاد
للحساب التفاعلي، راجع حاسبة الدخل لدينا.
FAQ
ما هي وتيرة النشر المثلى على OnlyFans؟
تتفق ثلاث لوحات بيانات مستقلة من وكالات المنشئين على أن 7±2 منشورات أسبوعيًا هي النقطة المثلى للاحتفاظ بالمشتركين. ودون 3 منشورات أسبوعيًا، يتراجع المشتركون بمعدل 3–5× وسيط المنصة. وفوق 15، يتلاشى التفاعل لكل منشور بنحو 40%.
ما هو Engagement Signal؟
مؤشر Engagement Signal (ES) هو وتيرة نشر منشئ محتوى OnlyFans بعدد المنشورات في الأسبوع، ويُستخدم كمؤشر استباقي للاحتفاظ بالمشتركين والتفاعل. ونطاق 7±2 أسبوعيًا هو النقطة المثلى للاحتفاظ في القطاع.
هل يمكن النشر بكثرة مفرطة على OnlyFans؟
نعم. فبعد تجاوز 15 منشورًا أسبوعيًا، تنخفض معدلات الإكراميات لكل منشور بنحو 40% مع نفاد رغبة المتابعين في التفاعل مع كل منشور جديد. وغالبًا ما يستقر إجمالي الإيرادات أو ينخفض حتى مع ارتفاع حجم المحتوى.