


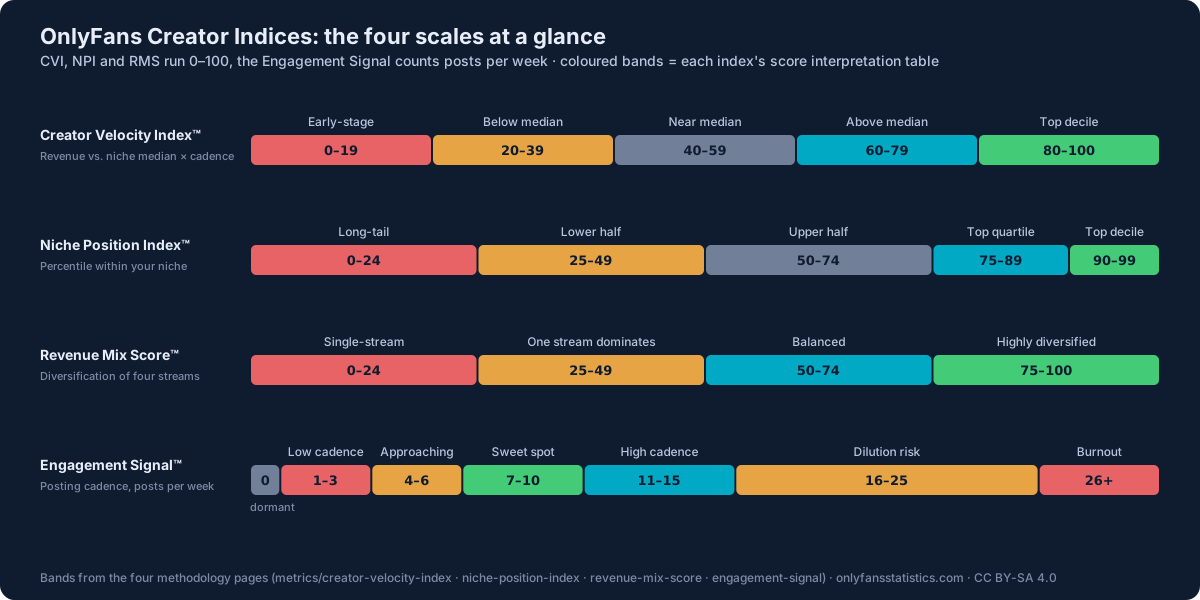
The OnlyFans creator economy is hard to benchmark with raw dollars alone. A $5,000/month creator might be top 8% platform-wide but only top 35% within their niche. A creator with 100% subscription income looks identical to one with diversified revenue, until subs churn. We built four indices to capture these dimensions in numbers journalists, agencies and creators can actually quote.
Each index is normalized to a fixed scale (0–100 for three of them, raw count for the fourth), uses publicly disclosed source data, and refreshes quarterly. The math is open: see each index page for the formula and worked examples.
The four indices
Why we built them
Three reasons:
- Niche-fair comparison. Platform-wide percentiles are heavily distorted by celebrity-tier outliers. A solid fitness creator earning $5,000/month places in roughly the top 8% platform-wide but only the top 35% of fitness creators. Which figure is actually useful? The niche one. NPI captures it.
- Trajectory vs revenue. Raw monthly revenue doesn't distinguish between a creator on a sustainable upward trajectory (high cadence, growing audience) and one peaking before burn-out. CVI does.
- Fragility detection. Two creators earning $1,000/month look identical until subscription churn hits the one whose income is 95% subs. RMS surfaces that risk quantitatively.
How to cite
Each index page includes a worked citation example. Generic template:
For interactive use, every index is calculated automatically in our income calculator, enter your numbers, get all four scores back.
Underlying data
All four indices draw from:
- Fenix International Ltd FY2024 audited filings (UK Companies House), for platform-wide revenue and account totals
- Agency creator-management panel data (three independent firms, anonymized), for niche-level income distributions
- Similarweb traffic-by-country data: for geographic context
- Public reporting (Forbes, Variety, etc.): for celebrity-tier income disclosures
See our methodology page for the full sourcing approach and update cadence.