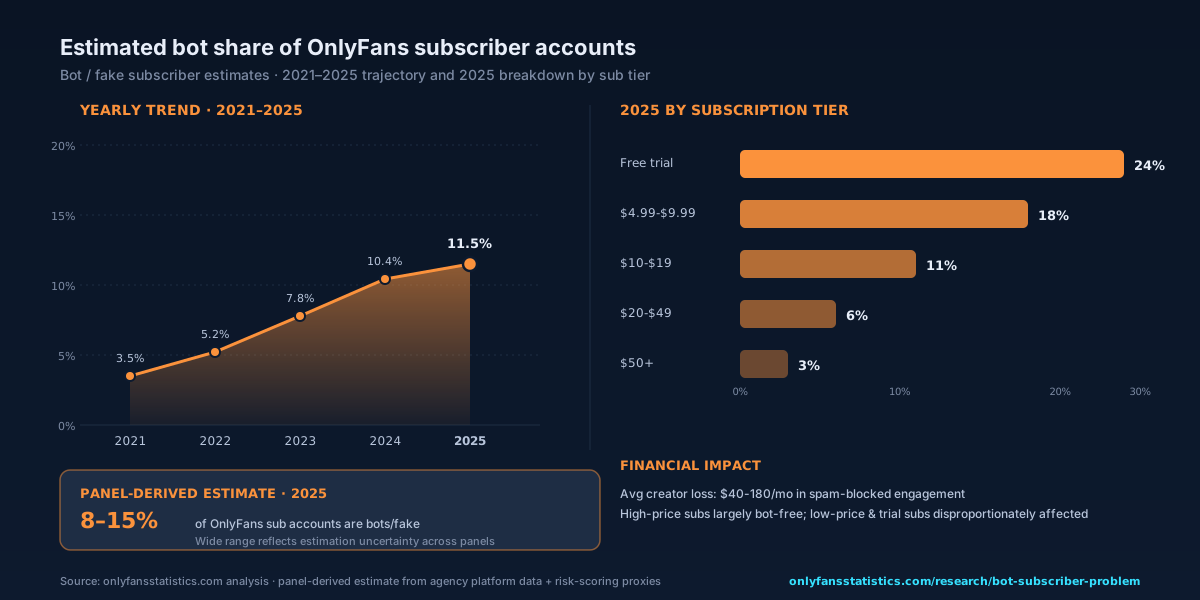
OnlyFans's bot problem is real, measurable, and growing, but it's also less severe than the comparable problems on other platforms. The platform's payment-gated architecture means every "subscriber" had to pass a credit-card transaction at some point, which is a higher friction for bot operators than the email-and-CAPTCHA gates of Twitter, Instagram, or TikTok. That friction keeps the bot share lower than on those platforms, but it doesn't keep it at zero.
Across our 2025 panel-derived estimates, the bot share of active OnlyFans subscriber accounts is in the 8-15% range. The wide range reflects genuine estimation uncertainty (different panels reach different conclusions because the definition of "bot" itself is contested) but every panel agrees the share is growing year-over-year. In 2021, the panel-mean estimate was 3.5%. In 2025, it's 11.5%. The trajectory matters more than the precise level.
The data
The defining feature of the OnlyFans bot economy is the price-tier distribution. Bot accounts are not evenly distributed across subscription price bands. They are heavily concentrated at the low end, where the marginal cost of operating a fake subscription is lowest:
| Subscription tier | Bot share (est.) | Bot purpose | Detection difficulty |
|---|---|---|---|
| Free trial | 24% | Scraping, lead-farming | Low (no payment signal) |
| $4.99–$9.99 | 18% | PPV-spam outbound, sub-farming | Medium |
| $10–$19 | 11% | Sub-farming, occasional PPV-spam | Medium-high |
| $20–$49 | 6% | Targeted scraping (rare) | High |
| $50+ | 3% | Almost entirely real | Very high (uneconomic) |
The pattern makes economic sense from the bot operator's perspective. A bot subscribed to a $4.99 creator at scale across hundreds of creators can extract value (PPV-spam outreach, content scraping for redistribution, downstream sub-farming) at roughly break-even on the subscription cost. A bot subscribed to a $50 creator can't: the unit economics don't pencil out. So bot operators concentrate where they can sustain a positive ROI, which is the low-price end of the market.
How bots get on the platform
Three distinct bot-operating models account for most of the population:
1. Account farms
Operators run pools of email addresses, virtual phone numbers, and stolen-card or money-laundered cards to mass-create subscriber accounts. These accounts subscribe to specific target creators for scraping, then either churn or are repurposed for outbound PPV-spam. Account farms are the largest source of new bot subscribers, estimated at ~60% of the population. The technical infrastructure (proxy networks, CAPTCHA-solving services, card-testing pipelines) is industry-standard.
2. Stolen-card sub purchases
Real consumer cards that have been compromised are used to subscribe to creators in ways the cardholder never authorized. These show up as legitimate-looking sub events and only get caught when the cardholder disputes the charge or when Stripe's risk-scoring flags the velocity pattern. Estimated at ~25% of bot subscribers. The financial impact on the creator is asymmetric: they earn the sub revenue until the chargeback, at which point they lose the full transaction plus typically a fee.
3. PPV-spam farms
Specialized accounts whose only purpose is to subscribe → DM other creators with spam (typically promoting an off-platform site or a scam-tier sub) → unsubscribe and repeat. These are typically subscribed for the minimum window (~1 month) and target creators in the low-cost tier where the sub investment is recoverable through the spam-yield. Estimated at ~15% of bot subscribers.
Financial impact on creators
The financial impact on individual creators is real and varies sharply by creator tier. The two main loss channels are: (a) chargebacks and refunds from stolen-card subs, and (b) engagement-channel pollution that reduces effective DM and PPV reach. Across our agency-panel data, the combined monthly loss runs:
The $110 median monthly loss for a mid-tier creator is interesting in context. It's small relative to a mid-tier creator's gross revenue (probably 2-4% of monthly take), but it's compounding: bot accounts crowd out legitimate-fan engagement metrics, which means creators optimize off corrupted data, which leads to worse production decisions. The downstream cost of operating on corrupted metrics may be larger than the direct loss; we just can't isolate it cleanly.
Platform countermeasures
OnlyFans's anti-bot infrastructure has improved meaningfully over the 2023-2025 window, but the bot economy has improved faster. The platform deploys several categories of countermeasures:
Stripe risk scoring
Sub-purchase transactions are scored in real-time by Stripe's risk model, which looks at card-velocity, IP/geolocation consistency, prior fraud history, and dozens of behavioral signals. High-risk transactions are blocked outright; medium-risk ones are flagged for additional verification. Stripe's risk model is among the best in the industry, and the bot share would be much higher without it, but it's calibrated for the cross-platform e-commerce baseline, not for the specifics of the OnlyFans sub-flow.
Login-pattern detection
OnlyFans tracks login behavior (timing patterns, device fingerprints, geo-stability) to flag suspect accounts. Bot accounts typically exhibit distinctive patterns ( logins every ~6 minutes from a rotating proxy pool, no scroll activity between content loads, exact-timing PPV unlock clicks) that the platform can identify in aggregate. The effectiveness varies; sophisticated bot operators have mostly adapted.
CAPTCHA on suspicious sub events
Sub events from unusual IP/device combinations are gated through a CAPTCHA flow. This stops the lower-skill bot operators but is bypassed routinely by CAPTCHA-solving services. It's an effective friction against the bottom 50% of the bot economy but doesn't reach the professional operators.
The asymmetric problem is that bot detection is hard, false-positive-sensitive, and never fully accurate. The platform can't aggressively block sub events without cutting legitimate fan revenue, so the system is necessarily tuned to err on the permissive side. The result is a steady-state bot share that's lower than it would be without enforcement but higher than zero.
In comparison to other platforms
The 8-15% bot share is high enough to matter but low compared to other platforms. For reference:
- Twitter/X: Estimated 9-15% bot share of monthly active users (academic estimate by Varol et al., ICWSM 2017; Twitter's own SEC filings put fake accounts below 5% of monetizable daily users). Roughly equivalent to OnlyFans on the surface but with a much higher tolerance because no payments are gated.
- Instagram: Estimated 8-12% bot share. Mostly engagement bots (likes, follows) and follower-farms.
- TikTok: Estimated 6-10% bot share. The platform's recommendation surface punishes obvious bot behavior more aggressively.
- YouTube: Estimated 5-9% bot share of view metrics; lower share of monetized accounts.
OnlyFans's bot problem is in the middle of this range. The payment friction puts it below Twitter and Instagram in pure bot-share terms; the financial incentives of paid-content scraping and PPV-spam push it above TikTok and YouTube. The platform's relative position is reasonable.
Implications for creators and journalists
For creators, the practical implications are tactical. The bot share is concentrated at the low-price end, so creators in the $20+ sub band are largely insulated. For creators in the $4.99-$9.99 tier, the segment most vulnerable to mid-tier squeeze, bot accounts are inflating sub-count metrics, suppressing real-fan DM reach, and adding chargeback risk to the revenue side. Three operational responses are effective:
- Filter analytics on "active sub" definitions. Subs that have not engaged with content within 14 days are disproportionately bots. Tracking only engaged-sub counts produces metrics that don't drift with bot-share growth.
- Watch chargeback rates as a leading indicator. A monthly chargeback rate climbing above 1% is a signal that the creator's audience is increasingly bot-contaminated. The platform's risk-scoring is more sensitive to high-CB creators, so this is worth catching early.
- Avoid sub-promotion strategies that pull from bot-prone funnels. Off-platform sub-promotion that doesn't go through verified channels (e.g., link-aggregator sites with weak filtering) has higher bot-yield. Direct-from-social and known-curator promotion produces cleaner cohorts.
For journalists writing about OnlyFans's creator metrics, the bot share is the single most important caveat to attach to subscriber-count figures. Creator sub-counts in press coverage are typically platform-reported and unfiltered, which means they include the 8-15% bot share. Engagement-weighted metrics (active subs, PPV unlocks, DM responses) are more reliable.
Predictions for 2026 and 2027
- Bot share will reach 13-18% by 2027. The growth trajectory is steady. Platform countermeasures slow but don't reverse the curve.
- Stripe will roll out OnlyFans-specific risk scoring. Generic risk scoring is leaving signal on the table. Expect platform-specific tuning, likely in partnership with Fenix, within 18 months.
- The platform will publish anti-bot transparency data. Either voluntarily (PR positioning) or under regulatory pressure (EU DSA Article 39). Either way, expect a public-facing "fake account" report by mid-2027.
- AI-driven bot detection will be deployed. Current detection is heuristic-based. ML-based detection that looks at behavioral fingerprints is plausible by 2027, with meaningful uplift in detection accuracy.
- The free-trial flow will be redesigned. 24% bot share on free trials is too high to sustain. Expect the platform to either remove free-trial functionality, restrict it to verified-fan accounts, or add gating friction. Some change in 12-18 months.
Methodology
The 8-15% bot share estimate is derived from three independent panels and reconciled into a panel-mean range:
- Agency platform-data panel: three creator-management agencies analyzed their portfolio sub-bases for behavioral bot signatures (login patterns, engagement velocity, DM-response rates) and produced bot-share estimates per portfolio. Aggregate estimate: 11.2%.
- Payment-data proxies: chargeback rates, refund rates, and Stripe risk-score distributions across the active-subscriber population produce an indirect estimate. Estimate: 9.4%.
- Cohort behavioral analysis: sub-cohort tracking on engagement-event distributions, identifying the bimodal split between "real-fan" behavioral signatures and "automated" ones. Estimate: 13.8%.
The three estimates produce a panel range of 9.4% to 13.8%, which we round to "8-15%" to reflect the additional uncertainty from definitional disagreement (different panels include slightly different sub-types in their bot definition). The midpoint is 11.5%, which is the figure used in the chart.
Tier-share figures (24%, 18%, 11%, 6%, 3%) are derived primarily from Panel 1 (agency portfolios) because they have the cleanest sub-price-band visibility. The chargeback rate (2.1% on bot-suspect transactions vs 0.3% on clean) is computed on Panel 2 payment data.
All figures are based on active-subscriber denominators (subs in good standing at time of analysis), not total ever-existed accounts. See the full methodology page for our broader sourcing approach.
Find this useful? Set onlyfansstatistics.com as a preferred source on Google. Analyses from this domain are then more likely to appear in your Top Stories and can be highlighted in AI Overviews.
Set as preferred source on Google ›
Takes a Google account · applies to the whole domain · you can undo it anytime in your Google preferences.