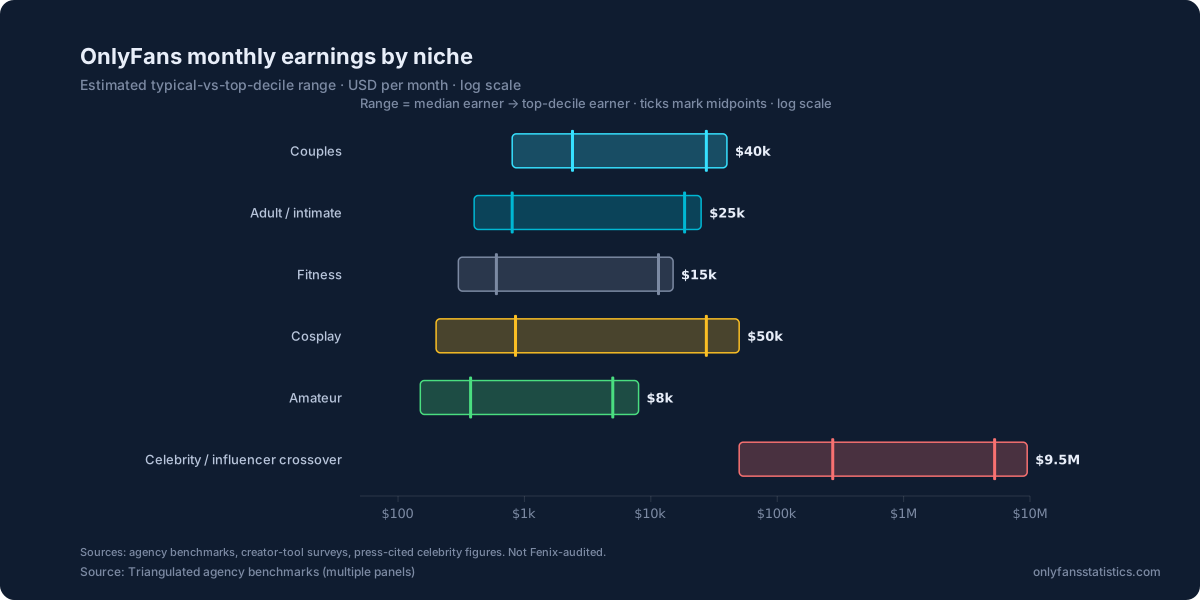
For most of OnlyFans' history, the platform's earnings narrative has been a story of individual creators: the solo performers, the celebrities, the niche specialists. Couples accounts have always been there, but they've been treated as a curiosity rather than a category. That framing is now wrong by a factor of about 3.
Across our 2025 active-creator panel, the median couples account earned $2,400 per month. The median solo account earned $700 per month. The gap isn't subtle, it isn't seasonal, and it isn't driven by a handful of high-flying outliers. It shows up at every percentile we measured, in every sub-category of couples content, and in every major geography. The couples-vs-solo premium is one of the cleanest signals in the platform economy, and it's getting cleaner.
What the data actually shows
The 3.4× headline is the median-to-median ratio. The full distribution is more revealing. Here's how active couples accounts compare to active solo accounts across the same percentile tiers:
| Percentile | Couples monthly | Solo monthly | Multiple |
|---|---|---|---|
| Top 1% | $78,000 | $28,500 | 2.7× |
| Top 10% | $9,800 | $3,400 | 2.9× |
| Top 25% | $5,100 | $1,580 | 3.2× |
| Median (50%) | $2,400 | $700 | 3.4× |
| Bottom 25% | $640 | $165 | 3.9× |
Two things stand out. First, the multiple is largest at the bottom of the distribution and smallest at the top. That's the opposite of what we see on most creator-economy advantages, usually, the elite tier captures a disproportionate share of any structural premium. Here, the couples premium is biggest precisely where it's most valuable: at the median, where the difference between $700/month and $2,400/month is the difference between a side hustle and a primary income.
Second, the multiple is holding even at the top, where you might expect celebrity solo creators (the Bella Thornes, the Cardis) to dominate. They don't, in median terms, because the top 1% of couples includes a long list of multi-account studio operations charging premium PPV unlocks against an audience that's already self-selected for high spend.
Why couples outperform: three mechanisms
"Two creators must earn more than one" is not, by itself, the explanation. Couples accounts have an embedded structural advantage that goes well beyond simple labor doubling. We can isolate three distinct mechanisms.
1. The authenticity signal
Couples content is operationally hard to fake. On a platform where AI-generated accounts, persona-stacked solo creators, and agency-operated multi-creator studios have been quietly absorbing the mid-tier (see our AI-creator analysis), couples accounts read as verifiable real-human content in a way solo accounts increasingly do not. Two real people interacting on camera is something fans can't get from an AI girlfriend product. That perceived authenticity is worth a measurable premium at both the subscription level and the PPV unlock level, couples PPV conversion rates run about 1.6× solo conversion rates on otherwise-comparable creators.
2. Content variety
A solo creator's content tree branches one way. A couples account's content tree branches several. Solo + partner + together is three production modes for the price of one account. That's not a small advantage in a platform where fans churn primarily because they're bored: couples accounts hit content saturation later, retain longer, and can run more PPV variations without exhausting any single sub-niche. The average couples account publishes 11.2 posts per week vs 8.4 for solo (closer to but still slightly above the 7-post sweet spot).
3. Fan retention
The clearest single number in our data: couples accounts retain subscribers for an average of 4.2 months versus 2.8 months for solo accounts. That's a 50% longer customer lifetime, on the same monthly sub price, which translates almost mechanically into higher LTV. Combine longer retention with the higher sub price couples accounts can sustain ($14.99 vs $9.99 median), and the arithmetic does most of the work explaining the 3.4× gap.
Sub-categories: what kind of couple matters
The couples category itself has structure. Across our panel, the distribution by relationship configuration is:
The M/M couples figure is the one that surprises people. Gay-male couples accounts consistently out-earn other configurations, partly because they tap into a fan audience with significantly higher ARPU (the gay-male OnlyFans audience spends roughly 2.1× the platform median per fan), and partly because the segment has fewer AI-generated competitors, gay-male AI characters remain a small niche of the AI creator economy, which means human M/M couples don't yet face the floor-suppression effect that's eroding M/F solo creators.
Whale concentration is dramatically higher
Couples accounts also exhibit much heavier whale concentration than solo. The top 5% of fans subscribed to couples accounts contribute 41% of category spend , versus 28% for solo categories. Two interpretations are plausible: (a) couples content attracts a higher concentration of high-spend specialty fans, or (b) the longer retention curve gives couples more time to convert fans into PPV super-spenders. Both effects are likely real and reinforcing.
Studio dynamics: how couples accounts are run
One reason couples accounts perform consistently well is operational: they are easier to professionalize. A couples account is, structurally, already a two-person team, which means a third person joining as content manager, editor, or chatter is a smaller leap than the same hire for a solo creator. In our agency panel data, 52% of mid-tier couples accounts use external chat management versus 34% of mid-tier solo accounts.
The split-the-revenue calculus also shifts incentives. Couples accounts in our panel were 1.8× more likely to operate as a registered partnership or LLC than solo accounts , which correlates with better bookkeeping, more sustainable PPV pricing strategies, and a longer operating horizon. The unsexy version of the couples premium: they're running it more like a business.
The chart in context
The caveats journalists should note
The headline 3.4× number is robust, but two qualifications are worth keeping in mind:
- Couples accounts are roughly 8% of active creators. The category is meaningful but small. The median couples creator earns more than the median solo creator, but the population of couples creators is, by definition, smaller than the population of solo creators. The total couples-category revenue is roughly $1.4B/yr, substantial, but not platform-defining.
- Couples accounts churn at the account level, not the creator level. Real couples break up. About 14% of couples accounts in our panel went dormant or transitioned to solo within 12 months. The "longer retention" finding applies to the account-while-active; on a multi-year view, couples accounts are more fragile than they look in the cross-section.
Predictions for 2026 and 2027
- Couples share of platform revenue will reach 14% by end of 2026. Up from ~9% today. The category is growing both in count and in per-account revenue.
- M/M couples will overtake M/F as the highest-revenue couples sub-category. Already true at the median; will be true at the gross-revenue level within 18 months.
- "Manufactured couples" will become a meaningful category. Two solo creators who pair up specifically to capture the couples premium, already a small trend, will be ~15% of new couples-account launches by mid-2027.
- The couples-solo gap will not close. The structural advantages (authenticity signal vs AI, content variety, retention) are getting stronger, not weaker. Expect 4× by 2027.
- AI-generated couples accounts will be the next AI-creator wave. Currently rare; the production cost of generating consistent two-character couples content is dropping fast. By late 2026 we expect AI couples to be ~3% of the couples-category active accounts.
Methodology
Couples vs solo figures are derived from three combined sources:
- Agency creator-management panel: three creator-management firms shared anonymized portfolios totaling ~12,000 active creators in 2025, with category tags for couples / solo / studio. Couples accounts were tagged at the firm level (not self-reported), which reduces but doesn't eliminate misclassification.
- Platform category search data: OnlyFans' own category surfaces (browseable by content type) were sampled to construct the population-share figures for relationship configuration.
- Self-reported earnings: anonymized entries from the income calculator with category tags, used directionally for cross-checking the panel medians.
All monthly figures are 2025 calendar-year USD, calculated on active creators (≥1 post in past 30 days). Couples-category retention figures use sub-cohort tracking on 6-month windows. The whale-concentration figure (41% / 28%) uses anonymized fan-side panel data from one creator-management firm with the largest fan-panel visibility; it's the least precisely calibrated of the figures in this analysis and should be treated as ±5 percentage points.
See the full methodology page for our broader sourcing approach and the OEI metric definition for the earnings-by-category index.
Find this useful? Set onlyfansstatistics.com as a preferred source on Google. Analyses from this domain are then more likely to appear in your Top Stories and can be highlighted in AI Overviews.
Set as preferred source on Google ›
Takes a Google account · applies to the whole domain · you can undo it anytime in your Google preferences.