
Revenue TL;DR
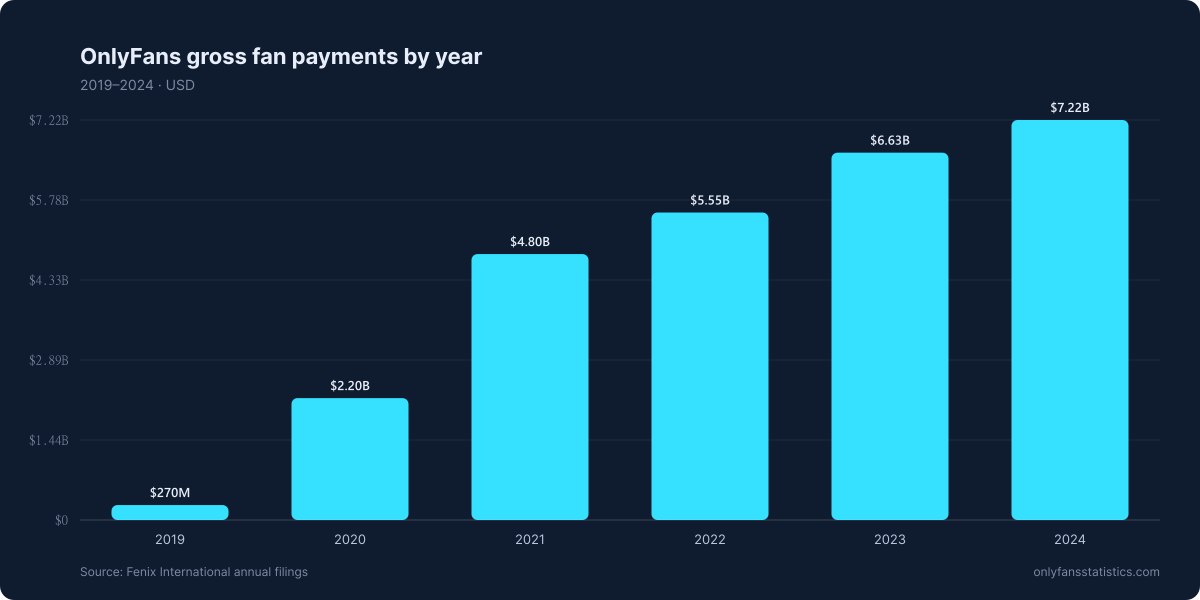
- $7.22B FY2024 gross fan payments — single largest in platform's history
- +9% YoY over $6.63B in 2023
- +2,574% over 5 years (from $0.27B in 2019)
- $5.80B creator payouts (80%) · $1.41B platform net (20%)
- Audited by external accountants via UK Companies House filings
FY2024 revenue figures
OnlyFans's parent Fenix International Ltd reported $7.22 billion in gross fan payments for fiscal year 2024 (twelve months ending 30 November 2024). That's the total value of subscriptions, pay-per-view sales, tips, and direct messages processed before any deductions. It's a 9% increase over $6.63B in 2023.
Revenue trajectory 2019–2024
| Year | Gross fan payments | YoY growth |
|---|---|---|
| 2019 | $0.27B | — |
| 2020 | $2.20B | +715% |
| 2021 | $4.80B | +118% |
| 2022 | $5.55B | +16% |
| 2023 | $6.63B | +19% |
| 2024 | $7.22B | +9% |
Why YoY growth slowed
Three patterns visible in the YoY trajectory:
- 2020: +715% — COVID-19 effect. Lockdowns + creator displacement created the steepest single-year jump in the platform's history.
- 2021–2023: 16–118% — sustained scaling. Each year added $0.7B–$1.1B in absolute terms.
- 2024: +9% — first single-digit growth year. Markets are maturing; platform is no longer in pure category-creation mode.
How the $7.22B splits
- $5.80B (80%) → creator payouts under the platform's flat 80/20 split
- $1.41B (20%) → platform net revenue (Fenix International)
- From that $1.41B, $684M dropped to pre-tax profit (margin 9.5%)
The remaining $726M between net revenue and pre-tax profit covers operating costs: payment processing, content moderation, infrastructure, compliance, payroll, and marketing. That cost base grew faster than revenue in FY2024 (the only year that's happened on record).
vs. competitor creator platforms
| Platform | Annual revenue | Audited? |
|---|---|---|
| OnlyFans | $7.22B (2024) | Yes (UK) |
| Patreon | ~$300M (estimated) | No |
| Twitch | ~$2B (Amazon segment) | Yes (parent) |
| Substack | ~$45M (estimated) | No |
| Fansly | Not disclosed | No |
Comparison figures for non-OnlyFans platforms are estimates.
Sources
- [FENIX-2024] Fenix International Ltd — UK Companies House FY2024 audited filing.
- [FENIX-PRIOR] Fenix International Ltd — Prior fiscal year filings (2019–2023).