


Why diversification matters
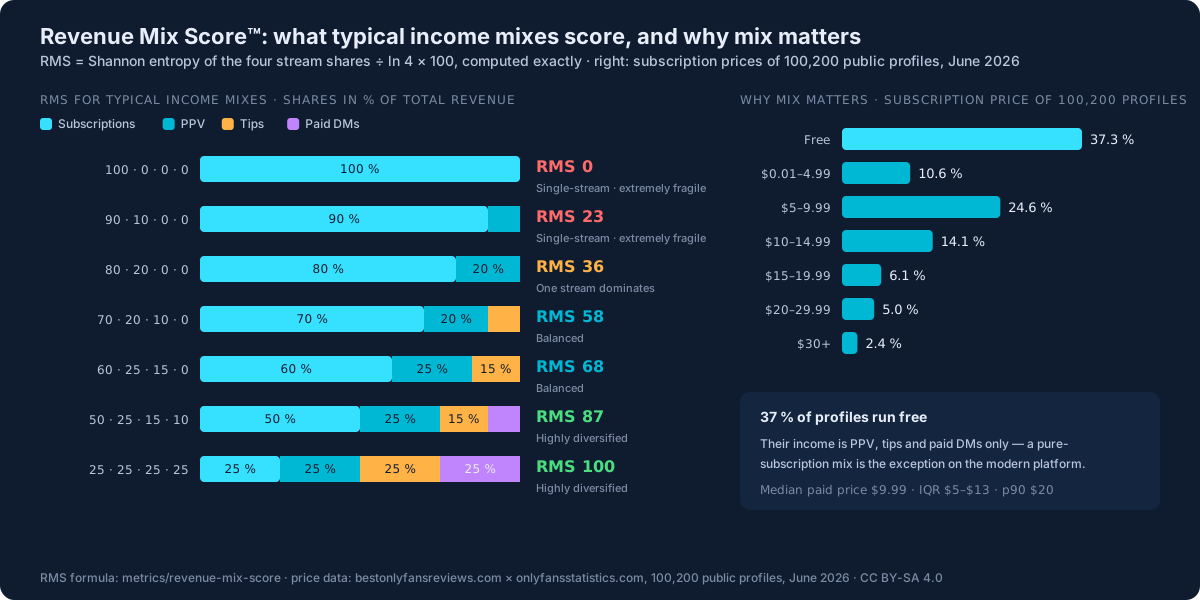
Two OnlyFans creators each earning $1,000/month look identical until subscription churn hits. The one whose income is 95% subscriptions takes a 19% revenue hit on a 20% churn event. The one with 60% subs + 25% PPV + 15% tips/DMs takes a smaller hit, recovers faster, and has multiple revenue levers to pull in response.
RMS measures this kind of resilience quantitatively. It's drawn directly from Shannon's entropy formula (the canonical measure of distribution diversity from information theory) applied to the four standard OnlyFans revenue streams.
Formula
Why Shannon entropy?
It's the canonical "diversity" measure from information theory, developed for exactly this kind of distributional question. A 100% single-stream income has entropy = 0. Perfectly even distribution (25% / 25% / 25% / 25%) reaches max entropy = log(4) ≈ 1.39, which we scale to 100. Real creators fall in between.
Crucially, entropy weighs the marginal value of each new stream correctly: going from 100% subs to 95% subs + 5% PPV adds more diversification value than going from 50% / 30% / 15% / 5% to 50% / 25% / 20% / 5%. Linear "share count" metrics miss this.
New (June 2026): our creator pricing dataset (100,200 public profiles, analyzed by bestonlyfansreviews.com) shows why mix matters: 37% of profiles run free and monetize entirely through PPV and tips, a pure-subscription mix is the exception, not the rule, on the modern platform.
Score interpretation
| Score | Interpretation |
|---|---|
| 75 – 100 | Highly diversified. All four streams contribute meaningfully. Anti-fragile to churn in any one stream. |
| 50 – 74 | Balanced. Two or three streams carry significant share. Moderate resilience. |
| 25 – 49 | Sub-dependent or PPV-dependent. One stream dominates; lose it and revenue drops sharply. |
| 0 – 24 | Single-stream. Extremely fragile. A single product policy change or churn wave wipes out most income. |
Worked examples
Example 1: Sub-only creator. $1,000/month all from subscriptions, $0 PPV, $0 tips, $0 DMs. Entropy = 0. RMS = 0. Maximally fragile.
Example 2: Average creator. $500 subs + $300 PPV + $150 tips + $50 DMs (= $1,000/month total). Shares: 0.5, 0.3, 0.15, 0.05. Entropy ≈ 1.14. RMS = round(1.14 / 1.39 × 100) ≈ 82. Highly diversified.
Example 3: Top-decile creator. $20,000 subs + $10,000 PPV + $5,000 tips + $2,000 DMs (= $37,000/month total). Shares: 0.54, 0.27, 0.14, 0.05. Entropy ≈ 1.11. RMS = round(1.11 / 1.39 × 100) ≈ 80. Similar shape, different scale.
Example 4: PPV-heavy creator. $200 subs + $800 PPV + $0 tips + $0 DMs. Shares: 0.2, 0.8, 0, 0. Entropy ≈ 0.50. RMS = round(0.50 / 1.39 × 100) ≈ 36. Sub-dependent inversion: fragile to PPV fatigue or content-policy changes.
Important caveats
- RMS doesn't measure absolute revenue. A creator earning $50/month with $25 from each stream gets RMS 100. They're still earning $50/month. Combine RMS with absolute revenue thresholds before drawing conclusions.
- It doesn't tell you whether diversification is "effective". Adding $1/month of tips to a $1,000/month sub income raises RMS but doesn't make you meaningfully anti-fragile. Think of RMS as a necessary but not sufficient condition.
- Stream definitions are fixed at four. Real OnlyFans creators may have additional minor income streams (custom video, agency referral, etc.). Those don't enter the RMS calculation.
- RMS is path-blind. A creator who got to 25/25/25/25 by accident scores the same as one who deliberately diversified. The score doesn't capture strategy quality.
Use cases
- Creator strategic planning: "Should I push PPV more?" If your RMS is below 50, yes, diversification is your highest-leverage move. If RMS is already 75+, you're better off focusing on absolute revenue.
- Agency risk analysis: Agencies managing portfolios of creators can use RMS distribution to assess portfolio-level income fragility. Many agencies' books are unintentionally sub-heavy.
- Industry trend tracking: Is the platform's average creator RMS rising or falling over time? Falling would indicate sub-fatigue and increased fragility platform-wide.
- Creator-tool product strategy: Tools that help creators monetize tips, DMs or PPV specifically can use low-RMS segments as their target market.
How to cite
For interactive calculation see our income calculator.
FAQ
What is the Revenue Mix Score?
The Revenue Mix Score (RMS) is a 0–100 measure of income diversification for OnlyFans creators. It applies Shannon entropy to the four standard revenue streams (subscriptions, PPV, tips, paid DMs) and scales the result so 100 is perfect diversification and 0 is single-stream.
Why use Shannon entropy?
Shannon entropy is the canonical diversity measure from information theory. It correctly weighs the marginal value of each additional revenue stream, going from 100% subs to 95% subs + 5% PPV adds more diversification value than going from 50/30/15/5 to 50/25/20/5.
What's a good RMS score?
75+ is highly diversified and anti-fragile. 50–74 is balanced. Below 25 is single-stream and very fragile to churn or product policy changes.