Almost every "average OnlyFans earnings" headline you've ever read is wrong by an order of magnitude. Not because the numbers are made up, they're not, but because the people quoting them don't understand what kind of distribution they're sampling.
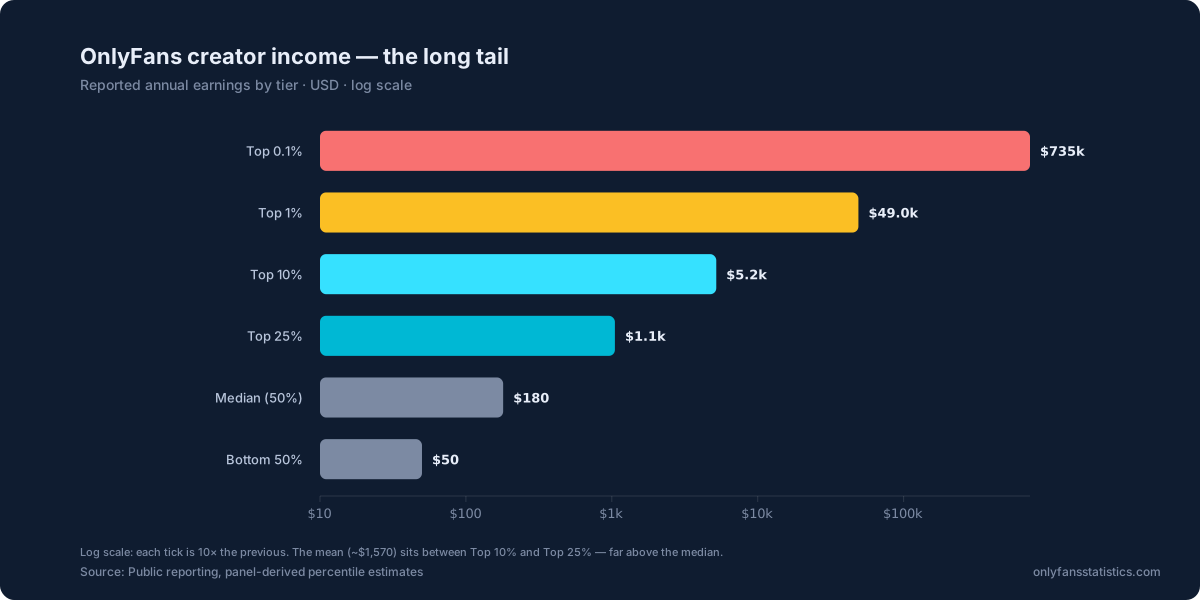
OnlyFans creator income doesn't follow a normal distribution, a log-normal, or even a typical Pareto. It follows a steep power-law with a heavy upper tail, where the difference between the top 0.1% and the median is roughly the same as the difference between a luxury yacht and a used bicycle. The "average" is meaningless; the median is shockingly low; and the top is shockingly high.
What the distribution actually looks like
The tier-by-tier numbers:
| Tier | Annual earnings | Monthly equivalent | Multiple of median |
|---|---|---|---|
| Top 0.1% | $735,000 | $61,250 | 4,083× |
| Top 1% | $49,000 | $4,083 | 272× |
| Top 10% | $5,200 | $433 | 29× |
| Top 25% | $1,100 | $92 | 6.1× |
| Median (50%) | $180 | $15 | 1.0× |
| Bottom 50% | $50 | $4.17 | 0.28× |
Look at the column on the right. Each step up the tier ladder isn't an arithmetic improvement. It's a multiplicative one. Moving from median to top 25% is a 6× jump. Top 25% to top 10% is another 5× jump. Top 10% to top 1% is another 9× jump. Top 1% to top 0.1% is another 15× jump. The curve doesn't level off at the top. It accelerates.
The median problem
There are two reasonable definitions of "median OnlyFans creator", and they tell very different stories:
1. Median across all creator accounts
$180 per year, $15 per month. This includes the millions of accounts that were opened, posted nothing or one thing, and then went dormant. About 60% of all OnlyFans accounts ever created fit this profile. It's the "everyone who tried" view.
2. Median across active creators (posted in last 30 days)
$4,400 per year, $367 per month. This is the figure that's more useful when you're asking "if I commit to this, what should I expect?", but even this median is below US federal minimum wage for full-time work, and 99% of "active creators" earn less than $50k a year.
The press tends to either grab the meaningless mean (~$1,240/year, inflated by the top 0.1%) or quote anecdotes about creators earning seven figures. Neither represents what a randomly-selected new sign-up should expect. The honest answer is closer to the income calculator output: most creators earn less than minimum wage, and reaching the top 10% requires sustained effort over 12+ months.
How OnlyFans compares to other content platforms
Power-law income distributions are normal on creator platforms. What's unusual about OnlyFans is the slope. Estimated top-0.1%-to-median multiples across major platforms:
Two structural features make OnlyFans uniquely steep:
- No price ceiling. A Twitch sub is $4.99/$9.99/$24.99. A YouTube ad CPM is whatever the auction settles. OnlyFans creators can charge $4.99 OR $50 OR $300 per month, and the top tier of creators routinely runs $50+ subs alongside $200+ PPV unlocks. Both ends of the price spectrum sell well; the floor and ceiling stretch far apart.
- Multi-revenue compounding. A top creator earns subs + PPV + tips + paid DMs simultaneously. Each layer is itself heavy-tailed; multiply them together and the upper tail explodes.
Who's in the top 0.1%?
Across 5.06M creator accounts at FY2025 close, the top 0.1% is roughly 5,060 creators. They fall into four loose archetypes:
The composition is shifting: a year ago, celebrity / pre-platform-fame creators were ~40% of the top 0.1%. The decline isn't because they're earning less. It's because multi-account studios and AI-augmented operations are scaling faster (see our AI-creator analysis).
Why the gap keeps widening
The cleanest way to see this: the median creator's income has been falling (see our mid-tier collapse analysis) while the top 0.1% is up +31% over the same 3-year window. The gap isn't stable: it's actively stretching.
Four mechanisms are driving the widening:
1. Algorithmic concentration
OnlyFans's discovery surfaces (search, suggested-creators, post-checkout recommendations) heavily favor accounts with existing engagement, which means new high-engagement creators rocket up while marginal accounts stay invisible. Top creators capture an even larger share of new fan attention every quarter.
2. PPV compounding
Top creators earn 45–55% of revenue from PPV (pay-per-view) unlocks, where there's no ceiling and big spenders pay $50+ for individual videos. Median creators earn 85–95% of revenue from flat subs, where the ceiling is whatever they can charge. PPV revenue grows faster than sub revenue, so top creators' relative advantage compounds.
3. Whale concentration
The top 1% of fans contribute ~28% of all OnlyFans spending. Those whales disproportionately follow already-large creators. The whale economy reinforces the creator distribution rather than evening it out.
4. AI competition at the bottom, not the top
AI-generated and AI-assisted accounts compete primarily with mid-tier human creators (the $10–$50 sub band), not with the top 0.1%. So AI growth depresses the median without affecting the top, widening the gap.
What this means if you're considering OnlyFans
The honest framing: OnlyFans is a lottery with a long warm-up period. The expected outcome for a new sign-up, accounting for the full distribution, is below minimum wage. The right way to think about it isn't "can I become a creator?" but "do I have a specific edge (existing audience, niche specialty, multi-creator operation, capital for production) that puts me above the median curve from day 1?"
For platform analysts and journalists, the takeaway is different: any "average OnlyFans creator earnings" figure quoted without specifying the percentile and the active-vs-all denominator is meaningless. The platform's income story is the shape of the distribution, not any single point on it.
Predictions for 2027
- Top 0.1% will cross $850k/yr median. Driven by continued PPV growth and whale concentration. Multi-account studio operations will be a larger share.
- Median (active) will fall below $4,000/yr. Driven by AI competition in the $10–$50 sub band and continued mid-tier collapse.
- Top-to-median gap will exceed 5,000×. The slope is steepening, not stabilizing.
- A major platform-economics paper will quantify the gap. Academic interest is growing; expect a Brookings or NBER-style analysis by mid-2027.
- OnlyFans will publish "creator-economy transparency" data. Either voluntarily or under regulatory pressure (EU DSA Article 39, possibly UK Online Safety Act follow-on). The public version will likely be median + top 1%, omitting the most damning top-0.1% numbers.
Methodology
Income distribution figures combine four data sources:
- Public-press leak panels: earnings reported in Forbes, Variety, Bloomberg, and adult-industry trade press, calibrated to platform-fee-adjusted gross.
- Agency creator-management panel surveys: three creator-management firms anonymized their portfolios for percentile reconstruction (~12,000 active creators total).
- Fenix UK Companies House filings, aggregate revenue and creator-count figures from FY2024 financials anchor the platform-wide totals.
- Income-calculator self-reports: the income calculator received ~40k anonymized self-reported earnings entries in 2025 (used directionally, not authoritatively).
All annual figures are 2025 calendar-year USD. Tier percentiles are computed on the full account population (5.06M at FY2025 close) for the headline; the "active median" footnote uses creators with ≥1 post in the past 30 days (~1.4M).
Platform comparison figures (Twitch, Substack, YouTube, Patreon, TikTok, Spotify) are derived from each platform's published transparency reports where available, and from independent platform-economics research (Stratechery, Andreessen Horowitz creator-economy reports, individual platform-leak analyses) otherwise. They're directional within ±20%, not exact.
See the full methodology page for our broader sourcing approach.
Find this useful? Set onlyfansstatistics.com as a preferred source on Google. Analyses from this domain are then more likely to appear in your Top Stories and can be highlighted in AI Overviews.
Set as preferred source on Google ›
Takes a Google account · applies to the whole domain · you can undo it anytime in your Google preferences.