


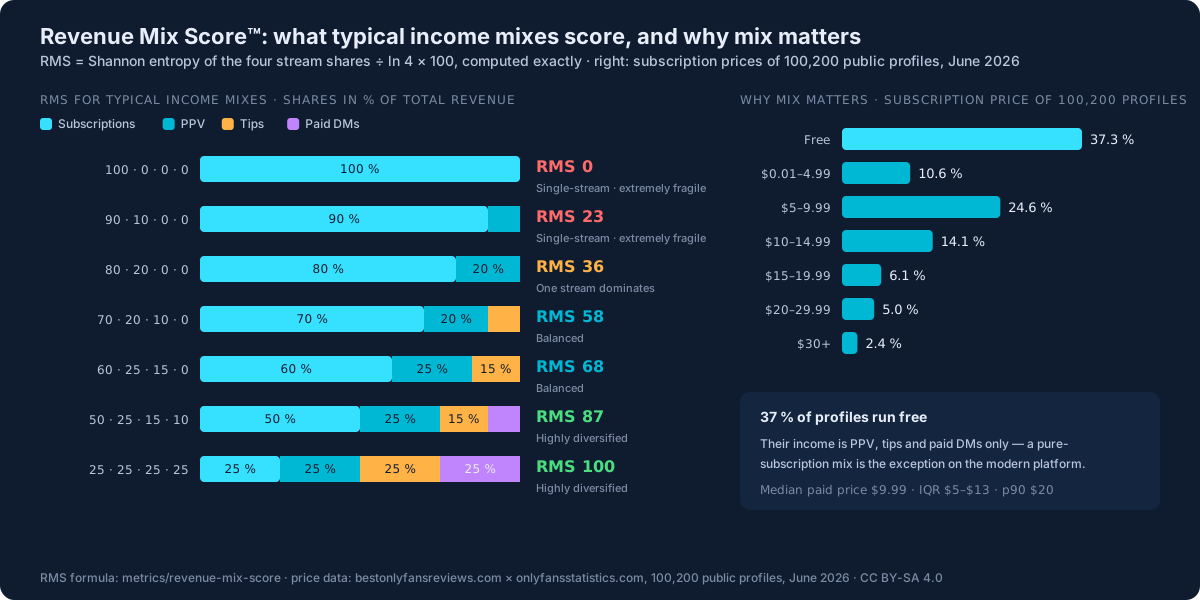
Hvorfor diversifisering betyr noe
To OnlyFans-creatorer som begge tjener $1,000/måned ser identiske ut — helt til oppsigelser slår til. Den hvis inntekt er 95% abonnementer, får et inntektsfall på 19% ved en oppsigelsesbølge på 20%. Den med 60% abonnementer + 25% PPV + 15% tips/DM-er tåler det bedre, kommer seg raskere og har flere inntektsspaker å trekke i som respons.
RMS måler denne typen motstandsdyktighet kvantitativt. Den er hentet direkte fra Shannons entropiformel — det etablerte målet på fordelingsmangfold fra informasjonsteori — anvendt på OnlyFans' fire standard inntektskilder.
Formel
Hvorfor Shannon-entropi?
Det er det etablerte «mangfolds»-målet fra informasjonsteorien, utviklet nettopp for denne typen fordelingsspørsmål. En inntekt fra 100% én enkelt kilde har entropi = 0. En perfekt jevn fordeling (25% / 25% / 25% / 25%) når maksimal entropi = log(4) ≈ 1.39, som vi skalerer til 100. Ekte creatorer havner et sted midt imellom.
Avgjørende er at entropi vekter marginalverdien av hver nye kilde korrekt: overgangen fra 100% abonnementer til 95% abonnementer + 5% PPV gir mer diversifiseringsverdi enn overgangen fra 50% / 30% / 15% / 5% til 50% / 25% / 20% / 5%. Lineære «andelstellende» målinger overser dette.
Tolkning av score
| Score | Tolkning |
|---|---|
| 75 – 100 | Sterkt diversifisert. Alle fire kilder bidrar betydelig. Motstandsdyktig mot bortfall i én enkelt kilde. |
| 50 – 74 | Balansert. To eller tre kilder utgjør en betydelig andel. Moderat motstandsdyktighet. |
| 25 – 49 | Avhengig av abonnementer eller PPV. Én kilde dominerer; mistes den, faller inntekten kraftig. |
| 0 – 24 | Én enkelt kilde. Ekstremt sårbar. En enkelt endring i produktpolicyen eller en oppsigelsesbølge utrydder det meste av inntekten. |
Gjennomregnede eksempler
Eksempel 1: creator med kun abonnementer. $1,000/måned utelukkende fra abonnementer, $0 PPV, $0 tips, $0 DM-er. Entropi = 0. RMS = 0. Maksimalt sårbar.
Eksempel 2: gjennomsnittlig creator. $500 abonnementer + $300 PPV + $150 tips + $50 DM-er (= $1,000/måned totalt). Andeler: 0.5, 0.3, 0.15, 0.05. Entropi ≈ 1.14. RMS = round(1.14 / 1.39 × 100) ≈ 82. Sterkt diversifisert.
Eksempel 3: creator i topp-desilet. $20,000 abonnementer + $10,000 PPV + $5,000 tips + $2,000 DM-er (= $37,000/måned totalt). Andeler: 0.54, 0.27, 0.14, 0.05. Entropi ≈ 1.11. RMS = round(1.11 / 1.39 × 100) ≈ 80. Lignende form, annen skala.
Eksempel 4: PPV-tung creator. $200 abonnementer + $800 PPV + $0 tips + $0 DM-er. Andeler: 0.2, 0.8, 0, 0. Entropi ≈ 0.50. RMS = round(0.50 / 1.39 × 100) ≈ 36. Omvendt abonnementsavhengighet — sårbar for PPV-tretthet eller endringer i innholdspolicyen.
Viktige forbehold
- RMS måler ikke absolutt inntekt. En creator som tjener $50/måned med $25 fra hver kilde, får RMS 100. Vedkommende tjener fortsatt bare $50/måned. Kombiner RMS med absolutte inntektsterskler før du trekker konklusjoner.
- Den forteller ikke om diversifiseringen er «effektiv». Å legge til $1/måned i tips til en abonnementsinntekt på $1,000/måned hever RMS, men gjør deg ikke merkbart mer motstandsdyktig. Se på RMS som en nødvendig, men ikke tilstrekkelig, forutsetning.
- Kildedefinisjonene er fastlåst til fire. Ekte OnlyFans-creatorer kan ha flere mindre inntektskilder (skreddersydde videoer, byråhenvisning m.m.). Disse inngår ikke i RMS-beregningen.
- RMS er veiblind. En creator som tilfeldigvis havner på 25/25/25/25, får samme score som en som bevisst har diversifisert. Scoren fanger ikke kvaliteten på strategien.
Bruksområder
- Strategisk planlegging for creatorer: «Bør jeg satse mer på PPV?» Hvis RMS-en din er under 50, ja — diversifisering er ditt sterkeste trekk. Hvis RMS allerede ligger på 75+, er du bedre tjent med å fokusere på absolutt inntekt.
- Risikoanalyse for byråer: Byråer som forvalter porteføljer av creatorer, kan bruke RMS-fordelingen til å vurdere inntektssårbarheten på porteføljenivå. Mange byråers porteføljer er utilsiktet tungt vektet mot abonnementer.
- Bransjetrend-overvåking: Stiger eller synker plattformens gjennomsnittlige creator-RMS over tid? En nedgang ville indikere abonnementstretthet og økt sårbarhet plattformbredt.
- Produktstrategi for creator-verktøy: Verktøy som hjelper creatorer med å spesifikt monetarisere tips, DM-er eller PPV, kan bruke segmenter med lav RMS som sitt målmarked.
Slik siterer du
For den interaktive beregningen, se vår inntektskalkulator.
FAQ
Hva er Revenue Mix Score?
Revenue Mix Score (RMS) er et 0–100-mål på inntektsdiversifisering hos OnlyFans-creatorer. Den bruker Shannon-entropi på de fire standard inntektskildene (abonnementer, PPV, tips, betalte DM-er) og skalerer resultatet slik at 100 betyr perfekt diversifisering og 0 en enkelt kilde.
Hvorfor bruke Shannon-entropi?
Shannon-entropi er det etablerte diversitetsmålet fra informasjonsteorien. Den vekter korrekt marginalverdien av hver ekstra inntektskilde — overgangen fra 100% abonnementer til 95% abonnementer + 5% PPV gir mer diversifiseringsverdi enn overgangen fra 50/30/15/5 til 50/25/20/5.
Hva er en god RMS-score?
75+ er sterkt diversifisert og motstandsdyktig. 50–74 er balansert. Under 25 betyr en enkelt kilde og er svært sårbar for oppsigelser eller endringer i produktpolicyen.