


"스위트 스팟" 이론
에이전시의 크리에이터 설문, 크리에이터 도구의 보고 데이터, Hoopr / Bunny Agency / Goon 같은 에이전시의 공개 보도라는 세 가지 독립된 출처가 모두 같은 결론에 도달했습니다: 주 7±2회 게시하는 OnlyFans 크리에이터는 다음을 갖추고 있습니다:
- 가장 높은 유지율(가장 낮은 월간 구독자 이탈률)
- 가장 좋은 게시물당 참여도(게시물당 좋아요, 팁, DM 구매)
- 계정 개설 후 첫 6~9개월간 가장 강력한 성장 추세
이 범위를 벗어나면 결과는 정반대 방향으로 무너집니다.
주 3회 미만: 이탈이 지배적
게시 빈도가 주 3회 미만으로 떨어지면 구독자는 플랫폼 중앙값의 3~5배 속도로 이탈합니다. 그 메커니즘은 다음과 같습니다: 팬은 지속적인 가치 제공을 기대하며 구독하는데, 플랫폼의 알림 시스템이 최근 활동한 크리에이터를 노출시킴으로써 이를 강화합니다. 게시 빈도가 낮은 크리에이터는 이 두 가지 측면 모두에서 불리해집니다.
주 15회 초과: 게시물당 참여도가 희석됨
팬들이 새 콘텐츠마다 참여하려는 의지를 소진하면서, 게시물당 팁 비율은 주 7~9회 범위 대비 약 40% 하락합니다. 게시물당 PPV 잠금 해제율도 비슷하게 희석됩니다. 콘텐츠 총량이 계속 늘어나더라도, 주 15회를 초과하면 PPV와 팁으로 인한 총수입은 종종 정체되거나 오히려 감소합니다.
이것이 성립하는 이유
그 근본적인 원리는 유한한 팬의 관심에 관한 것입니다:
- 각 팬은 크리에이터 1명당 주간 기준으로 대략 고정된 "관심 예산"을 가지고 있습니다 — 적극적인 참여에는 대략 10~15분, 가벼운 열람에는 30~60분 정도입니다.
- 주 3회 미만으로 게시하면 팬의 일상 또는 주간 습관에서 밀려나게 됩니다. 팬은 여러분을 잊게 되고, 다음 갱신 시점에 이탈합니다.
- 주 10회를 초과하면, 개별 게시물들이 같은 관심 예산을 두고 서로 경쟁하게 됩니다. 새 게시물마다 기존 게시물에서 예산의 일부를 가져갑니다. 그 결과 게시물당 총 참여도가 떨어집니다.
- 7±2 범위는 자신의 참여도를 스스로 잠식하지 않으면서도 꾸준히 팬의 최우선 관심에 머무를 수 있는 지점입니다.
게시 빈도 해석
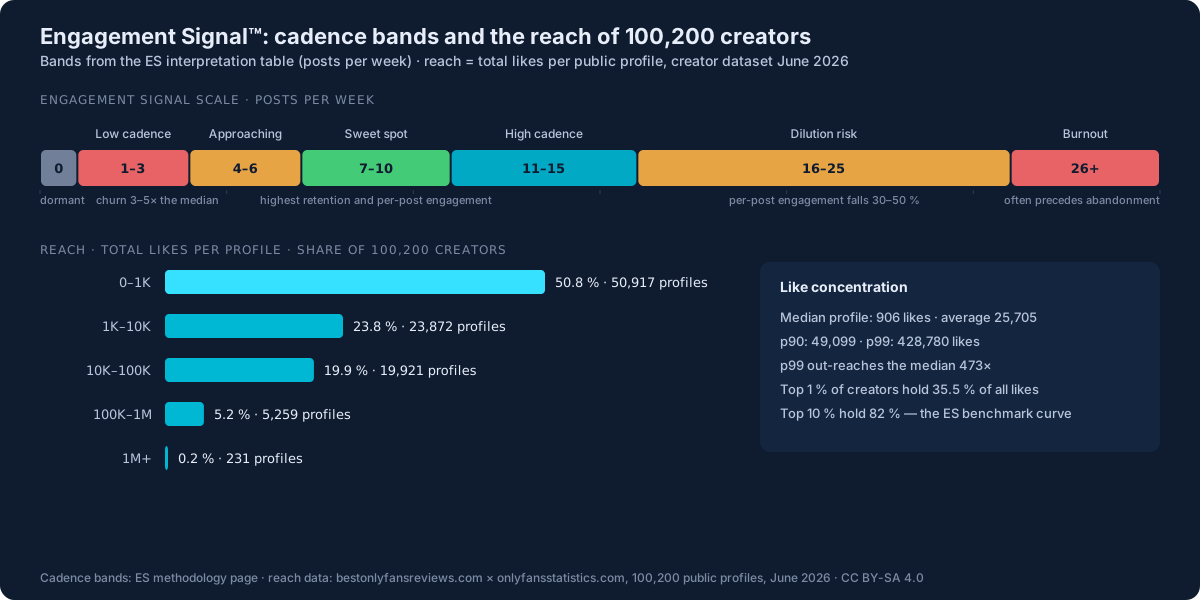
| 점수 | 해석 |
|---|---|
| 0 | 휴면. 계정에 최근 활동이 없음. 구독자는 60일 이내 거의 100% 이탈. |
| 1 – 3 | 낮은 빈도. 이탈 위험이 플랫폼 중앙값 대비 3~5배 높아짐. 빈도를 늘리거나 이탈을 받아들여야 함. |
| 4 – 6 | 스위트 스팟에 근접. 기본 참여도가 탄탄한 기존 크리에이터에게는 지속가능하지만, 신규 계정에는 위험함. |
| 7 – 10 | 스위트 스팟. 가장 높은 유지율과 게시물당 참여도. 업계 기준. |
| 11 – 15 | 높은 빈도. 여전히 효과적이지만 게시물당 참여도 희석에 주의해야 함; 수입이 정체될 수 있음. |
| 16 – 25 | 희석 위험. 게시물당 참여도가 30~50% 하락함. 콘텐츠가 늘어나도 총수익은 종종 정체되거나 감소함. |
| 26+ | 번아웃 빈도. 종종 60일 이내 계정 포기로 이어짐. 즉시 빈도를 줄여야 함. |
활용 사례
- 크리에이터 코칭: 가격 변경이나 수익원 추가를 제안하기 전에 먼저 ES를 확인해야 합니다. ES가 2인 크리에이터는 가격 문제처럼 보이지만 실제로는 게시 빈도 문제를 가지고 있습니다.
- 번아웃 위험 파악: 3개월 이상 ES가 20을 넘는 상태가 지속되는 것은 플랫폼에서 이탈하려는 미드티어 크리에이터와 강한 상관관계를 보입니다. 이는 에이전시가 개입할 수 있는 선행 지표입니다.
- 에이전시 포트폴리오 벤치마킹: "우리 에이전시의 평균 ES가 업계보다 높은가?" 높다면 고객들을 번아웃으로 몰아가고 있을 수 있습니다. 낮다면 확보할 수 있는 유지율을 놓치고 있을 수 있습니다.
- 제품 전략: 크리에이터에게 "이상적인 게시 빈도" 추천을 제시하는 크리에이터 도구 제품은 ES를 기반 지표로 삼을 때 측정 가능한 유지율 개선 효과를 보입니다.
제한사항
- ES는 당사의 4가지 지수 중 가장 단순합니다. 단순히 주간 게시물 수일 뿐입니다. 그럼에도 "지수"로 제공하는 이유는 해석 임계값이 실질적인 정보를 담고 있기 때문이며, 원자료 자체는 복잡한 계산이 아닙니다.
- 게시물의 질은 측정하지 않습니다. 정성 들인 주 7회 게시와 대충 캡처한 주 7회 게시는 다릅니다. 수익에 미치는 영향을 통해 질을 파악하려면 ES와 함께 Creator Velocity Index를 활용하세요.
- 미디어 유형은 반영하지 않습니다. 주 3편의 긴 영상을 올리는 크리에이터는 주 10장의 사진을 올리는 크리에이터와 비슷한 참여도 효과를 낼 수 있습니다. ES는 이 둘을 동일하게 취급합니다.
- 7±2 기준은 평균에서 도출된 값입니다. 개인별 스위트 스팟은 다양하며, 일부 니치(라이브캠 인접)는 더 높은 빈도가 유리하고, 일부(프리미엄 콘텐츠)는 더 낮은 빈도가 유리합니다.
인용 방법
인터랙티브 계산은 당사의 수입 계산기를 참조하세요.
FAQ
OnlyFans에서 최적의 게시 빈도는 무엇인가?
세 개의 독립된 에이전시-크리에이터 패널은 모두 주 7±2회 게시가 유지율 스위트 스팟이라는 결론에 도달했습니다. 주 3회 미만에서는 구독자가 플랫폼 중앙값의 3~5배 속도로 이탈합니다. 주 15회를 초과하면 게시물당 참여도가 약 40% 희석됩니다.
Engagement Signal이란 무엇인가?
Engagement Signal(ES)은 OnlyFans 크리에이터의 주간 게시 빈도를 나타내며, 유지율과 참여도의 선행 지표로 사용됩니다. 주 7±2회 범위가 업계의 유지율 스위트 스팟입니다.
OnlyFans에서 게시물을 너무 많이 올릴 수도 있는가?
그렇습니다. 주 15회를 초과하면, 팬들이 새 게시물마다 참여하려는 의지를 소진하면서 게시물당 팁 비율이 약 40% 하락합니다. 콘텐츠 양이 늘어나더라도 총수익은 종종 정체되거나 감소합니다.