


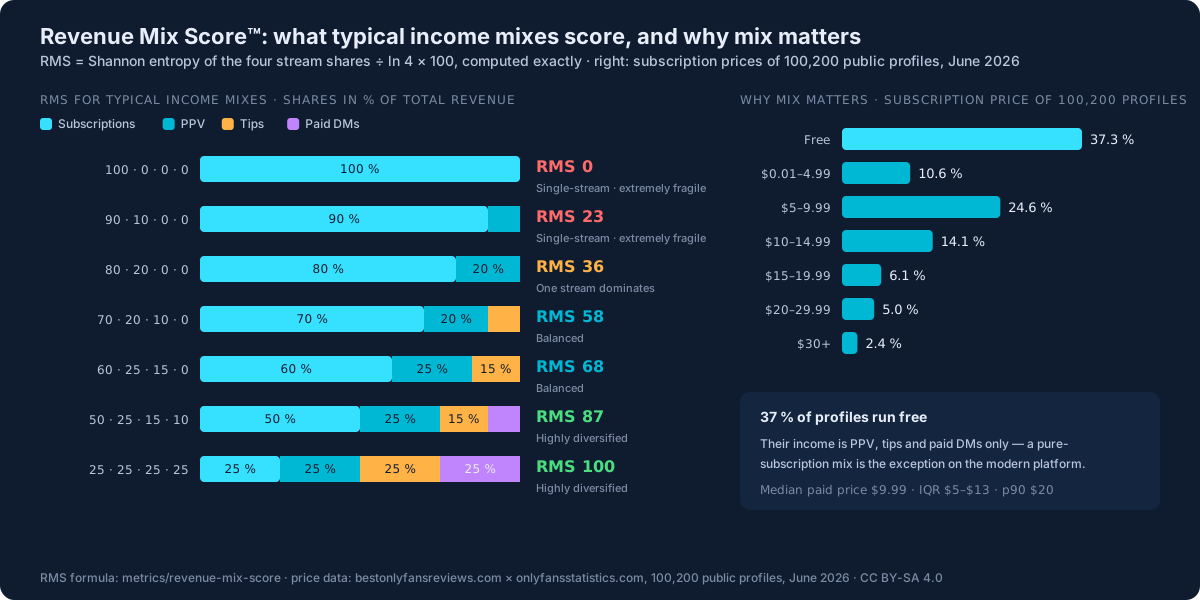
Γιατί έχει σημασία η διαφοροποίηση
Δύο δημιουργοί OnlyFans που κερδίζουν ο καθένας $1,000/μήνα φαίνονται πανομοιότυποι μέχρι να χτυπήσει η μείωση συνδρομών. Αυτός του οποίου το εισόδημα είναι 95% συνδρομές δέχεται πλήγμα εσόδων 19% σε ένα γεγονός μείωσης 20%. Αυτός με 60% συνδρομές + 25% PPV + 15% φιλοδωρήματα/DM δέχεται μικρότερο πλήγμα, ανακάμπτει ταχύτερα και διαθέτει πολλαπλούς μοχλούς εσόδων για να ενεργοποιήσει ως απάντηση.
Ο RMS μετρά αυτό το είδος ανθεκτικότητας ποσοτικά. Προέρχεται απευθείας από τον τύπο εντροπίας Shannon — το κανονικό μέτρο διαφοροποίησης κατανομής από τη θεωρία πληροφορίας — εφαρμοσμένο στις τέσσερις τυπικές πηγές εσόδων του OnlyFans.
Τύπος
Γιατί εντροπία Shannon;
Είναι το κανονικό μέτρο «διαφοροποίησης» από τη θεωρία πληροφορίας, που αναπτύχθηκε ακριβώς για αυτό το είδος ερωτήματος κατανομής. Ένα εισόδημα 100% από μία πηγή έχει εντροπία = 0. Μια απόλυτα ομοιόμορφη κατανομή (25% / 25% / 25% / 25%) φτάνει τη μέγιστη εντροπία = log(4) ≈ 1.39, την οποία κλιμακώνουμε στο 100. Οι πραγματικοί δημιουργοί βρίσκονται κάπου στο ενδιάμεσο.
Καθοριστικά, η εντροπία σταθμίζει σωστά την οριακή αξία κάθε νέας πηγής: η μετάβαση από 100% συνδρομές σε 95% συνδρομές + 5% PPV προσθέτει περισσότερη αξία διαφοροποίησης από τη μετάβαση από 50% / 30% / 15% / 5% σε 50% / 25% / 20% / 5%. Οι γραμμικές μετρικές «καταμέτρησης μεριδίου» δεν το αποτυπώνουν αυτό.
Ερμηνεία βαθμολογίας
| Βαθμολογία | Ερμηνεία |
|---|---|
| 75 – 100 | Έντονα διαφοροποιημένο. Και οι τέσσερις πηγές συνεισφέρουν ουσιαστικά. Ανθεκτικό σε μείωση σε οποιαδήποτε από τις πηγές. |
| 50 – 74 | Ισορροπημένο. Δύο ή τρεις πηγές έχουν σημαντικό μερίδιο. Μέτρια ανθεκτικότητα. |
| 25 – 49 | Εξαρτημένο από συνδρομές ή από PPV. Μια πηγή κυριαρχεί· αν χαθεί, τα έσοδα πέφτουν απότομα. |
| 0 – 24 | Μία πηγή. Εξαιρετικά εύθραυστο. Μια μόνο αλλαγή πολιτικής προϊόντος ή κύμα απώλειας συνδρομητών εξαλείφει το μεγαλύτερο μέρος του εισοδήματος. |
Λυμένα παραδείγματα
Παράδειγμα 1: Δημιουργός μόνο με συνδρομές. $1,000/μήνα εξ ολοκλήρου από συνδρομές, $0 PPV, $0 φιλοδωρήματα, $0 DM. Εντροπία = 0. RMS = 0. Μέγιστη ευθραυστότητα.
Παράδειγμα 2: Μέσος δημιουργός. $500 συνδρομές + $300 PPV + $150 φιλοδωρήματα + $50 DM (= $1,000/μήνα σύνολο). Μερίδια: 0.5, 0.3, 0.15, 0.05. Εντροπία ≈ 1.14. RMS = round(1.14 / 1.39 × 100) ≈ 82. Έντονα διαφοροποιημένο.
Παράδειγμα 3: Δημιουργός κορυφαίου δεκατημορίου. $20,000 συνδρομές + $10,000 PPV + $5,000 φιλοδωρήματα + $2,000 DM (= $37,000/μήνα σύνολο). Μερίδια: 0.54, 0.27, 0.14, 0.05. Εντροπία ≈ 1.11. RMS = round(1.11 / 1.39 × 100) ≈ 80. Παρόμοιο σχήμα, διαφορετική κλίμακα.
Παράδειγμα 4: Δημιουργός με βαρύ φορτίο PPV. $200 συνδρομές + $800 PPV + $0 φιλοδωρήματα + $0 DM. Μερίδια: 0.2, 0.8, 0, 0. Εντροπία ≈ 0.50. RMS = round(0.50 / 1.39 × 100) ≈ 36. Αντιστροφή εξάρτησης από συνδρομές — εύθραυστο σε κόπωση PPV ή αλλαγές πολιτικής περιεχομένου.
Σημαντικές επιφυλάξεις
- Ο RMS δεν μετρά τα απόλυτα έσοδα. Ένας δημιουργός που κερδίζει $50/μήνα με $25 από κάθε πηγή λαμβάνει RMS 100. Εξακολουθεί να κερδίζει $50/μήνα. Συνδυάστε τον RMS με απόλυτα όρια εσόδων πριν βγάλετε συμπεράσματα.
- Δεν σας λέει αν η διαφοροποίηση είναι «αποτελεσματική». Η προσθήκη $1/μήνα φιλοδωρημάτων σε εισόδημα συνδρομής $1,000/μήνα αυξάνει τον RMS αλλά δεν σας κάνει ουσιαστικά ανθεκτικούς. Σκεφτείτε τον RMS ως αναγκαία αλλά όχι επαρκή συνθήκη.
- Οι ορισμοί πηγών είναι σταθεροί στους τέσσερις. Πραγματικοί δημιουργοί OnlyFans μπορεί να έχουν επιπλέον δευτερεύουσες πηγές εισοδήματος (προσαρμοσμένο βίντεο, παραπομπή πρακτορείου, κ.λπ.). Αυτές δεν εισέρχονται στον υπολογισμό του RMS.
- Ο RMS είναι τυφλός ως προς τη διαδρομή. Ένας δημιουργός που έφτασε στο 25/25/25/25 τυχαία βαθμολογείται το ίδιο με κάποιον που διαφοροποιήθηκε σκόπιμα. Η βαθμολογία δεν αποτυπώνει την ποιότητα της στρατηγικής.
Περιπτώσεις χρήσης
- Στρατηγικός σχεδιασμός δημιουργού: «Πρέπει να δώσω περισσότερη έμφαση στο PPV;» Αν ο RMS σας είναι κάτω από 50, ναι — η διαφοροποίηση είναι η κίνηση με τη μεγαλύτερη μόχλευση. Αν ο RMS είναι ήδη 75+, είναι καλύτερο να επικεντρωθείτε στα απόλυτα έσοδα.
- Ανάλυση κινδύνου πρακτορείου: πρακτορεία που διαχειρίζονται χαρτοφυλάκια δημιουργών μπορούν να χρησιμοποιήσουν την κατανομή του RMS για να αξιολογήσουν την ευθραυστότητα εισοδήματος σε επίπεδο χαρτοφυλακίου. Πολλά χαρτοφυλάκια πρακτορείων εξαρτώνται ακούσια υπερβολικά από συνδρομές.
- Παρακολούθηση τάσεων κλάδου: ανεβαίνει ή κατεβαίνει με τον καιρό ο μέσος RMS των δημιουργών της πλατφόρμας; Μια πτώση θα υποδείκνυε κόπωση συνδρομών και αυξημένη ευθραυστότητα σε επίπεδο πλατφόρμας.
- Στρατηγική προϊόντος για εργαλεία δημιουργών: εργαλεία που βοηθούν τους δημιουργούς να μονετοποιήσουν συγκεκριμένα φιλοδωρήματα, DM ή PPV μπορούν να χρησιμοποιήσουν τμήματα με χαμηλό RMS ως στοχευμένη αγορά.
Πώς να παραθέσετε
Για τον διαδραστικό υπολογισμό, δείτε τον υπολογιστή εισοδήματός μας.
FAQ
Τι είναι το Revenue Mix Score;
Το Revenue Mix Score (RMS) είναι ένα μέτρο 0–100 της διαφοροποίησης εισοδήματος για δημιουργούς OnlyFans. Εφαρμόζει την εντροπία Shannon στις τέσσερις τυπικές πηγές εσόδων (συνδρομές, PPV, φιλοδωρήματα, επί πληρωμή DM) και κλιμακώνει το αποτέλεσμα ώστε το 100 να είναι τέλεια διαφοροποίηση και το 0 να είναι μία μόνο πηγή.
Γιατί να χρησιμοποιήσετε την εντροπία Shannon;
Η εντροπία Shannon είναι το κανονικό μέτρο διαφοροποίησης από τη θεωρία πληροφορίας. Σταθμίζει σωστά την οριακή αξία κάθε επιπλέον πηγής εσόδων — η μετάβαση από 100% συνδρομές σε 95% συνδρομές + 5% PPV προσθέτει περισσότερη αξία διαφοροποίησης από τη μετάβαση από 50/30/15/5 σε 50/25/20/5.
Τι είναι μια καλή βαθμολογία RMS;
75+ είναι έντονα διαφοροποιημένο και ανθεκτικό. 50–74 είναι ισορροπημένο. Κάτω από 25 είναι μία μόνο πηγή και πολύ εύθραυστο σε μείωση συνδρομών ή αλλαγές πολιτικής προϊόντος.